Soils show different states of stability depending on the water content. This property is described as consistency and specifies the state of a remolded and cohesive soil. The states range from:
(dry) solid state → semi-solid state → plastic state → liquid state (wet)
Different soils contain a specific amount of water at these different states of stability. In the early 1900s, the Swedish chemist Albert Atterberg developed a classification system and method with which these states of consistency could be determined. The method is based on the determination of the water content at distinct transitions between different states of soil consistency. These transitions are defined as shrinkage limit, plastic limit, and liquid limit, and are referred to as Atterberg limits. The liquid and plastic limits are the most commonly used. The values for these limits are dependent on various soil parameters (e.g., particle size, specific surface area of the particles that are able to attract water molecules).
These limits are used to derive indices (e.g., index of plasticity and index of consistency) and are often used for the mechanical characterization of soils.
Sample preparation and testing
For determining both plastic and liquid limits, the soil sample must first be sieved through a 0.425 mm sieve (#40 mesh).
It is advisable to test the liquid limit first. In coarse textured soils it is usually difficult to control water content for the liquid limit test and those soils may not even have a plastic limit.
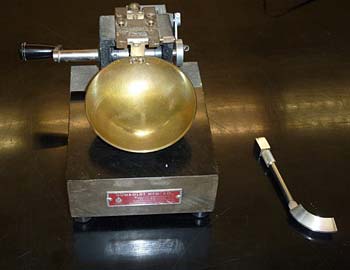
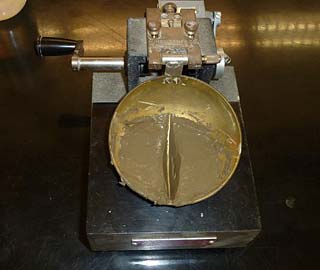
Liquid Limit is the soil water content where the soil changes from a plastic to a viscous (liquid) state. Liquid limit is determined using the Casagrande cup. This involves finding the soil water content that corresponds to the number of drops (25) needed to bring together a 13 mm section of a groove cut into the soil sample:
- The moistened sample is put into the Casagrande cup.
- A “V”-shaped groove is cut into the sample using a standardized tool.
- The cup is raised and dropped from a height of 10 mm, at a rate of about 2 drops per second.
- Stop when the bottom of the groove becomes joined along a distance of 13 mm.
- The number of drops required to close the groove is recorded. This number must be between 15 and 35 drops, so keep adjusting the water content of the sample until this is true.
- The water content is then determined gravimetrically by oven drying the soil sample at 105°C for 18 – 24 h.
The determination is usually repeated three times to obtain the average value for the liquid limit.
Plastic Limit is the soil water content at the boundary between the semi-solid state and plastic (flexible) state. It is determined as the gravimetric water content at which a soil sample can be rolled by hand into a thread of 3.2 mm diameter without breaking.
- Moisten the sieved soil sample so that it can be easily rolled between your hands.
- Roll the sample into an ellipsoid shape in your hands. Then, put the sample on a hard, smooth surface and roll into a thread using your fingers or palms. The goal is to roll a thread of 3.2 mm diameter.
- When the thread reaches the correct diameter, break it into pieces and knead it, reforming into an ellipsoid. Then, re-roll into a thread.
- Continue rolling, breaking, kneading, and re-rolling until the thread crumbles under the pressure and thus cannot be shaped into a 3.2 mm diameter thread. Gather the crumbled thread to determine the water content.
- Water content is determined gravimetrically oven drying the soil sample at 105°C for 18 – 24 h.
 b)
b) 
Photos by Maja Krzic. This work is licensed under a CC BY-NC-SA 4.0 International License.
The determination is usually repeated three times to obtain the average value for the plastic limit.
Calculations
Gravimetric soil water content = (mass of water)/(dry mass of soil)
LL = W _ (N/25)0.12
LL = liquid limit
N = number of drops (blows) required to close the groove
W = gravimetric soil water content
Example for the liquid limit determination
| Sample | # Drops | Wt of tin (g) | Moist soil + tin (g) | Dry soil + tin (g) | Liquid limit (kg kg-1) |
| 1a | 25 | 14.68 | 23.32 | 20.3 | 0.537 |
| 1b | 24 | 14.78 | 23.67 | 20.57 | 0.533 |
| 1c | 23 | 14.51 | 24.93 | 21.3 | 0.529 |
| Average | 0.533 |
Example for the plastic limit determination
| Sample | Wt of tin (g) | Moist soil + tin (g) | Dry soil + tin (g) | Liquid limit (kg kg-1) |
| 1a | 13.92 | 18.07 | 16.97 | 0.361 |
| 1b | 14.35 | 19.54 | 18.16 | 0.362 |
| 1c | 14 | 19.35 | 17.93 | 0.361 |
| Average | 0.361 |
References & Resources
- Gravimetric soil water content
- McBride, R.A. 2002. Atterberg limits. p. 519-527. In J.H. Dane and G.C. Topp (eds.) Methods of soil analysis. Part 4. Physical methods. SSSA Book Series no. 5. SSSA, Madison, WI.